
What Are the Top Green Solar Energy Solutions in 2026?
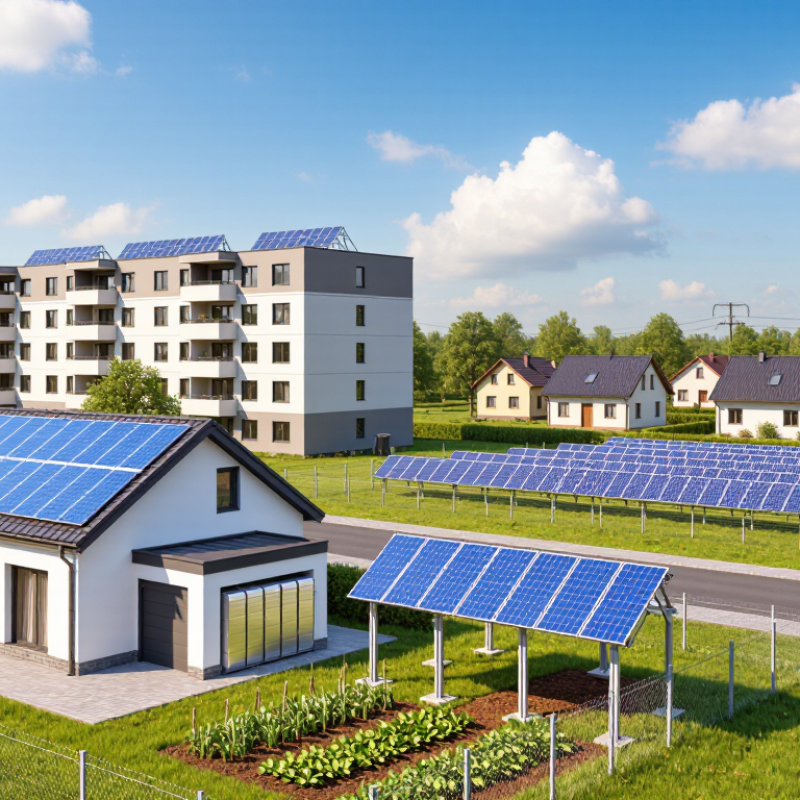
In 2026, green solar energy solutions offer more than rooftop panels. They can combine solar generation, battery storage, and smarter energy controls. For homeowners, that may mean panels facing the morning sun and a battery in the garage, ready to supply evening lights. For renters or households with shaded roofs, community solar can provide another route. The right choice depends on location, electricity use, budget, and available roof space.
Energy-efficiency expert and Rocky Mountain Institute co-founder Amory Lovins has expressed a useful principle: “The cheapest energy is the energy you don’t use.” That idea matters when comparing solar options. A well-insulated home may need a smaller system. A battery can shift some solar power into the evening, but it adds cost and does not suit every household. Details matter.
This guide explores leading options, including rooftop photovoltaic panels, home batteries, community solar, agrivoltaics, and building-integrated solar. It also considers practical questions: how systems perform through cloudy days, what maintenance involves, and which claims deserve a closer look. Some solutions sound impressive on paper. Real-world results can be less tidy. That is worth acknowledging. The strongest choice is not always the newest technology; it is the system that fits local conditions and can be assessed with clear, reliable information.
Solar PV Basics: IEA Forecasts 5,500 GW of Renewable Additions by 2030
Solar PV converts daylight into electricity through panels, an inverter, and household wiring. The IEA forecasts about 5,500 GW of renewable capacity additions worldwide by 2030. This is a broad renewable-energy projection, not a solar-only target. Solar is expected to contribute substantially, alongside wind and other sources. For homeowners, the shift can mean rooftop panels, shared solar projects, or grid-connected systems. Small systems matter. Yet new capacity does not automatically mean reliable power everywhere. Grids, storage, and local planning must keep pace.
Tips: Check your roof’s shade at different times of day, not just at noon. Compare expected yearly output with your actual electricity use. Ask how the system handles outages; many grid-connected systems shut off during blackouts unless paired with suitable backup equipment.
The forecast points to rapid growth, but installation quality and local conditions shape real results. Dust, snow, heat, and poor panel placement can reduce output. A battery may help shift solar electricity into evening hours, though it adds cost and materials. One blind spot is assuming every region can expand at the same speed. Permits, grid connections, and skilled installers vary, and forecasts can miss these practical delays. A careful site assessment is less exciting than a big capacity figure, but it can reveal whether a proposed system fits a home’s needs.
Utility-Scale PV: IRENA Reports a 90% LCOE Decline Since 2010
Utility-scale solar has changed sharply since 2010. IRENA’s Renewable Power Generation Costs in 2023 reports that the global weighted average levelized cost of electricity (LCOE) for newly commissioned solar PV fell 90%, from $0.460 per kilowatt-hour to $0.044. That puts new solar among the lowest-cost sources of electricity in many markets. The shift is real. But LCOE is not the whole bill: a project still needs land, grid connections, inverters, and often storage to supply power when sunlight fades.
The International Energy Agency’s Renewables 2024 report projects about 5,500 gigawatts of renewable capacity additions worldwide between 2024 and 2030, with solar PV making up nearly 80% of the increase. That scale makes utility solar a leading green energy solution for 2026, especially where transmission can absorb midday output. Picture rows of panels feeding a substation; the harder question comes after noon, when production may exceed local demand. Grid upgrades and storage add costs that headline LCOE figures can miss. IRENA’s global averages also cannot predict every site. A low-cost desert project may still face delays, curtailment, or expensive transmission. The economics are impressive, though not effortless.
What Are the Top Green Solar Energy Solutions in 2026? — Utility-Scale PV: IRENA Reports a 90% LCOE Decline Since 2010
A practical comparison of utility-scale solar options, using published global benchmarks where available. Cost figures below are historical observations, not 2026 forecasts.
| Solution | Best suited for | Published benchmark or evidence | Planning considerations |
|---|---|---|---|
| Utility-scale solar PV | Large, grid-connected projects supplying electricity to the wholesale market or through power-purchase agreements. | Global weighted-average LCOE: USD 0.044/kWh in 2023. IRENA reports a 90% decline from USD 0.460/kWh in 2010. | Compare site-specific resource, grid-connection costs, land requirements, financing, and curtailment risk. The global average is not a project-level price. |
| Utility-scale PV with battery storage | Projects seeking to shift some solar generation to later hours or provide certain grid services. | IRENA’s cited 2023 PV LCOE benchmark is for solar PV; it is not a combined PV-and-battery cost benchmark. | Evaluate battery duration, usable energy, charging rules, degradation, replacement costs, and revenue opportunities alongside PV economics. |
| Floating solar PV | Suitable reservoirs and other qualifying water bodies where floating infrastructure is technically and environmentally appropriate. | No directly comparable global floating-PV LCOE is reported in the cited IRENA utility-scale PV benchmark. | Assess water-body ownership and use, anchoring, water-level variation, grid access, ecological impacts, and operations and maintenance. |
| Agrivoltaics | Sites where solar generation can be designed alongside continued agricultural activity. | No single global agrivoltaic LCOE is provided in the cited benchmark; results depend on system design, crop, and site. | Design around agricultural needs, including equipment access, crop light requirements, panel height and spacing, and land-use rules. |
| Rooftop and on-site solar PV | Homes, public buildings, commercial facilities, and industrial sites that can use or export electricity locally. | The USD 0.044/kWh figure is a utility-scale global weighted average and should not be applied directly to rooftop systems. | Account for roof condition, shading, structural capacity, local retail tariffs, self-consumption, permitting, and available export compensation. |
Source: International Renewable Energy Agency (IRENA), Renewable Power Generation Costs in 2023. The 2010 and 2023 LCOE figures are global weighted averages for utility-scale solar PV, expressed in USD per kilowatt-hour. LCOE is a generation-cost measure and does not by itself represent a retail electricity tariff or the total cost of a project with storage.
Rooftop Solar: NREL Uses a 25-Year System Life in Cost Benchmarks
Rooftop solar can look like a simple purchase, but its economics unfold over decades. NREL’s cost-benchmark modeling uses a 25-year system life, giving analysts a consistent period for comparing upfront costs with expected electricity production. That is a modeling assumption, not a promise that every installation will perform unchanged for 25 years. Roof leaks, inverter failures, shade from a growing tree, and delayed repairs can all affect actual results. A benchmark is tidy. A roof is not.
Berkeley Lab’s Tracking the Sun 2024 report found that the median residential rooftop system installed in 2023 was about 7.4 kilowatts. That figure offers context, not a sizing target: a home’s electricity use, roof direction, local shade, and usable roof area matter more. NREL’s long-term frame is useful because it encourages homeowners to compare lifetime output and maintenance needs, rather than focusing only on the first-year bill reduction. Still, estimates can miss small, costly details.
Tips: Ask for a production estimate that states its degradation and maintenance assumptions. Check the roof’s age before installation, and leave clear access around vents and service areas. Keep the estimate, equipment records, and repair history together; future you may need them.
Rooftop Solar: Estimated Output Over a 25-Year System Life
Illustrative production retention with an assumed annual degradation rate of 0.5%.
Output is indexed to 100% in year 0 and estimated using 100 × (1 − 0.005)years. This illustrative calculation gives about 88% of initial output after 25 years; actual system performance varies with equipment, climate, installation, and maintenance.
Solar-Plus-Storage: IEA Targets 1,500 GW of Global Storage by 2030
Solar-plus-storage is becoming a practical way to shift daytime power into evening demand. The International Energy Agency’s 2024 report, Batteries and Secure Energy Transitions, says global storage capacity needs to reach 1,500 GW by 2030 in its net-zero pathway—around six times today’s level. Batteries could provide about 1,200 GW of that capacity. This is a pathway estimate, not a guaranteed deployment target.
The timing matters. Ember’s Global Electricity Review 2025 reports that solar generation rose by 29% in 2024, reaching 6.9% of global electricity. Without storage, some midday output can be wasted when grids have more power than they need. A battery beside a solar farm can charge during bright hours and discharge after sunset, helping smooth that mismatch. Not every site fits. Storage sizing depends on local demand, grid capacity, weather, and how long batteries must deliver power. A system designed only around peak output may still disappoint on cloudy evenings; that trade-off deserves more attention than it often gets.
Lower-Impact Solar: Assess Agrivoltaics, Recycling, and Lifecycle Emissions
Lower-impact solar in 2026 is about more than adding panels. Agrivoltaics places solar arrays above crops, pasture, or pollinator habitat. At a test site, that can mean sheep grazing between rows or vegetables growing in partial shade. NREL’s InSPIRE research program studies how these systems affect land, water, and agricultural production. Results depend on crop, climate, and panel spacing; one layout will not suit every farm. That matters.
Solar’s climate impact also includes manufacturing, transport, and disposal. The IPCC’s Fifth Assessment Report estimated median lifecycle emissions of about 48 grams of CO₂-equivalent per kilowatt-hour for solar photovoltaic power, compared with about 820 grams for coal. These are global estimates, not a promise for every installation.
Recycling is another key measure: an IRENA and IEA-PVPS report projected 60–78 million tonnes of end-of-life solar panels worldwide by 2050. Recovering glass and metals could reduce waste, but collection systems and recycling capacity still need work.
Tips
Ask whether a project protects soil and habitat, and check how panels will be repaired and recycled. For agrivoltaics, look for crop-specific trial results, not just attractive renderings. A shaded field can be productive, but it can also underperform. When possible, compare the project’s full lifecycle emissions, not only its operating output.
Related Posts
-
How to Choose New Solar Energy Solutions for Global Buyers?
-

What Are the Top Clean Green Energy Solutions?
-
2026 Best Green Energy Solutions for Global Buyers
-
Why Choose Solar Energy Solutions for Your Home?
-
10 Best Solar Power Solutions for Sustainable Energy Use?
-
2026 Best Green Solar Energy Solutions for Sustainable Living?
CORPORATE HEADQUARTERS
North America
California
AGIC Energy North America LLC
13025 Danielson Street, Suite 105
Poway, CA 92064 – USA
Phone Number: +1 (858) 842 1513
Email: info@site_cc52bd27-560c-4f9d-bd66-63718fc42539
Sales: sales@site_cc52bd27-560c-4f9d-bd66-63718fc42539