What Are the Top Clean Green Energy Solutions?
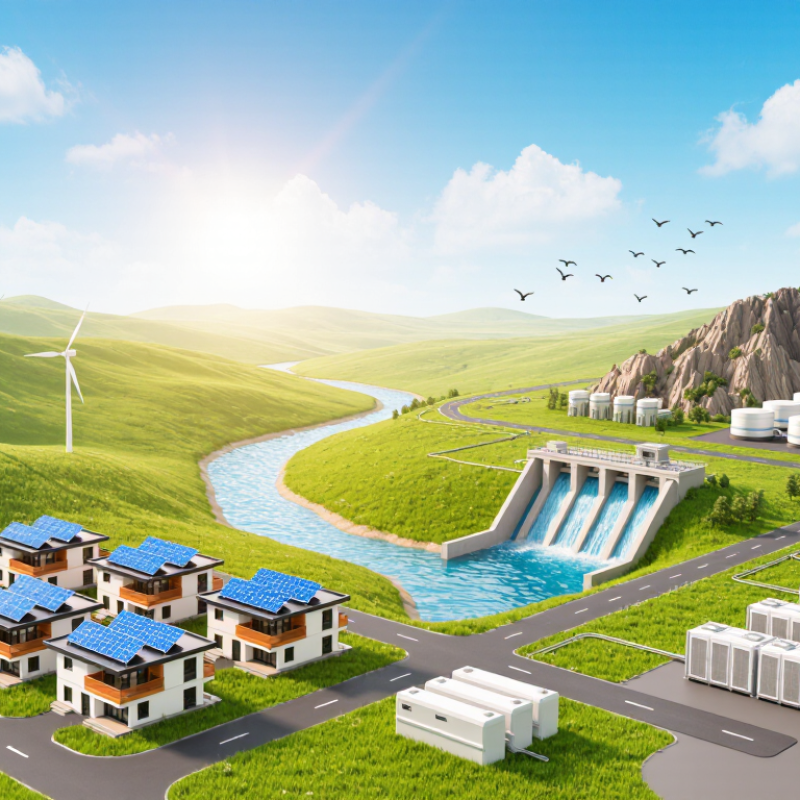
Clean green energy solutions are changing how homes, businesses, and communities produce and use electricity. Solar panels can turn a sunny rooftop into a local power source. Wind turbines generate electricity where wind conditions are suitable. Hydropower and geothermal systems can provide steadier output in the right locations. Each option has different costs, land needs, and operating conditions.
Choosing the right solution takes more than comparing headline prices. A reliable assessment considers local weather, grid access, equipment lifespan, maintenance, and the materials used in manufacturing. Energy storage can help balance supply when sunlight fades or wind slows, but batteries also require careful sourcing and end-of-life planning. No option is impact-free. That matters. This guide explores the leading technologies, how they work, and where they tend to fit best. It also looks at practical limits, including upfront investment, permitting, and effects on nearby ecosystems. Claims about savings or emissions should be checked against clear assumptions, since results vary by location and system design. There is no universal winner, and some projects still leave difficult trade-offs. Comparing evidence alongside real-world needs can help readers make more informed choices.
Clean Energy Solutions at a Glance: Renewables Reached 3,870 GW in 2023 (IRENA)
Clean Energy Solutions at a Glance: Renewables Reached 3,870 GW in 2023
Renewable power reached 3,870 gigawatts of installed capacity worldwide in 2023, according to the International Renewable Energy Agency’s Renewable Capacity Statistics 2024. That was a 13.9% increase in one year. Solar added about 346 GW, while wind contributed roughly 116 GW. These figures show why rooftop panels, large solar farms, and wind projects now sit at the center of clean energy planning. The scale is striking. Yet installed capacity does not mean electricity is available every hour.
Different solutions fill different gaps. Solar panels can generate power on warehouse roofs during sunny afternoons; wind turbines often produce more in windy regions and seasons. Hydropower and geothermal can provide steadier output where local conditions allow. Batteries shift some solar and wind electricity into evening hours, though storage adds cost and requires careful planning. The International Energy Agency’s Renewables 2023 report projected that solar and wind would drive most renewable capacity growth through 2028. That outlook is useful, but forecasts can miss local constraints, including slow grid connections and limited transmission. More clean capacity matters. So does getting it to people when they need it.
What Are the Top Clean Green Energy Solutions?
Clean Energy Solutions at a Glance: Renewables Reached 3,870 GW in 2023 (IRENA)
| Renewable solution | Global installed capacity at end of 2023 | Approx. share of renewable capacity | How it generates electricity | Commonly suited to | Practical consideration |
|---|---|---|---|---|---|
| Solar power | 1,419 GW | 36.7% | Photovoltaic panels convert sunlight directly into electricity; solar-thermal plants use heat to drive a turbine. | Rooftops, commercial sites, utility-scale projects, and sunny regions. | Output varies with sunlight and weather; storage or grid flexibility can help balance supply. |
| Hydropower | 1,268 GW | 32.8% | Moving or falling water turns turbines. Reservoir and pumped-storage facilities can also provide dispatchable power or storage. | Suitable river systems and locations with appropriate water resources and terrain. | Project impacts depend on site design; water availability and ecosystems require careful consideration. |
| Wind power | 1,017 GW | 26.3% | Onshore or offshore turbines convert wind energy into electricity. | Windy land areas, coastal regions, and offshore locations. | Generation varies with wind conditions; transmission access and careful siting are important. |
| Bioenergy | 150 GW | 3.9% | Electricity is produced from biomass or biogas, typically through combustion or gas engines. | Locations with sustainable feedstocks, including some agricultural and organic residues. | Climate benefits depend on feedstock sourcing, land use, and lifecycle emissions. |
| Geothermal power | 15 GW | 0.4% | Heat from underground reservoirs produces steam or heats a working fluid to drive a turbine. | Geologically suitable areas with accessible underground heat and fluids. | Resource exploration and drilling can be costly, and viable sites are geographically limited. |
| Marine energy | About 0.5 GW | Less than 0.1% | Wave, tidal, or ocean-current technologies capture energy from moving seawater. | Coastal locations with suitable waves, tides, or currents. | Technologies remain comparatively early-stage, with costs and marine conditions affecting deployment. |
Notes: Global installed-capacity figures are rounded and describe renewable power capacity, not electricity generated. Rounded category figures total approximately 3,870 GW. Capacity and technology categories are based on IRENA’s Renewable Capacity Statistics 2024; solution descriptions summarize general characteristics.
Related Posts
-
How to Choose Sustainable Energy Solutions in 2026
-
How to Choose Renewable Energy Solutions for Global Buyers?
-
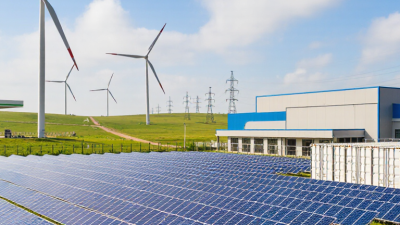
2026 Top Green Power Energy Solutions for Global Buyers
-
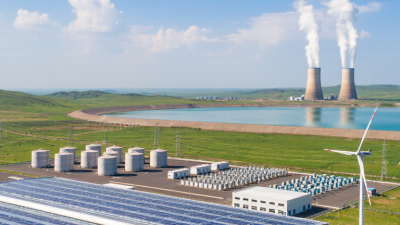
2026 Best Green Energy Solutions for Global Buyers
-
How to Choose Green Power Solutions for Your Business?
-
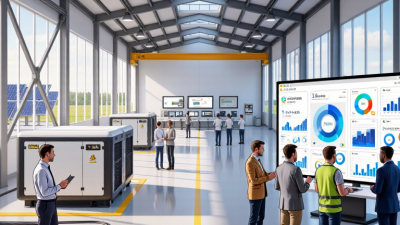
10 Clean Energy Solutions Tips for Global Buyers
CORPORATE HEADQUARTERS
North America
California
AGIC Energy North America LLC
13025 Danielson Street, Suite 105
Poway, CA 92064 – USA
Phone Number: +1 (858) 842 1513
Email: info@site_cc52bd27-560c-4f9d-bd66-63718fc42539
Sales: sales@site_cc52bd27-560c-4f9d-bd66-63718fc42539