+1 (858) 842-1249 

info@site_cc52bd27-560c-4f9d-bd66-63718fc42539 

sales@site_cc52bd27-560c-4f9d-bd66-63718fc42539

What Are the Best Green Power Energy Solutions in 2026?

Choosing green power energy solutions in 2026 means matching clean generation to demand, local weather, and grid conditions. Rooftop solar may suit a sunny warehouse with a broad roof. A heat pump can reduce fuel use in a drafty home, but insulation may need attention first. Small details matter. Shade across one row of panels can lower output. An undersized electrical service can change project costs. This guide compares leading options by cost, reliability, emissions, and practical fit—not promises alone.

IEA Executive Director Fatih Birol captured the transition this way. “The world is now in the early stages of a new industrial age—the age of clean energy technology.” Solar and wind remain central, while batteries, geothermal energy, hydropower, and modern heat pumps address different needs. Their performance varies. Batteries can shift electricity across hours, but not necessarily across seasons. Renewable projects also require materials, land, planning, and grid connections. Even credible solutions involve trade-offs.

The best choice depends on whether readers prioritize lower bills, backup power, reduced emissions, or energy independence. A farm, apartment block, and remote clinic will not share one answer. This guide examines installation constraints, operating life, maintenance, and realistic payback alongside environmental benefits. Figures change with tariffs and local conditions, so estimates deserve a careful check. There is no magic switch. The useful question is which combination works here and stays dependable when weather or demand shifts.
What Are the Best Green Power Energy Solutions in 2026?

What Green Power Energy Means and How Solutions Are Evaluated in 2026

In 2026, “green power” means electricity produced with low life-cycle greenhouse-gas emissions, not simply power carrying a renewable label. Solutions include wind and solar generation, hydropower, geothermal energy, and storage that helps match supply with demand. The test is practical: can a system deliver dependable electricity with lower environmental impact? A rooftop array, for example, may cut daytime grid use but still need storage or backup after sunset. Definitions matter.

IRENA’s Renewable Capacity Statistics 2025 reports that renewable capacity grew by 585 gigawatts in 2024, representing about 92.5% of total power-capacity additions. That is a large shift, but installed capacity alone does not show how much electricity reaches customers when needed. Emissions comparisons help. IPCC lifecycle assessments estimate median emissions of roughly 11 grams of CO₂-equivalent per kilowatt-hour for wind and 48 for solar photovoltaics, compared with about 490 for gas-fired power. These are estimates, not guarantees; manufacturing, location, and operating conditions affect actual results.

A useful 2026 evaluation weighs lifecycle emissions, delivered cost, reliability, land and water use, and grid connection time. For a home, compare expected annual output with actual bills and evening demand, not just panel capacity. For a community project, examine whether storage or transmission can reduce curtailment during sunny or windy hours. Check assumptions in every forecast. One metric never tells the whole story. There is room to question rosy projections, especially where local grid data is thin.

How Solar, Wind, Hydropower, and Geothermal Generate Clean Electricity

In 2026, the strongest clean-electricity mix depends on local weather, geography, and grid needs. Ember’s Global Electricity Review 2025 reports that renewables supplied 32% of global electricity in 2024. Hydropower contributed the largest share, while wind and solar together reached about 15%. IRENA recorded 585 gigawatts of renewable capacity added that year. Impressive growth, but capacity is not the same as electricity delivered every hour.

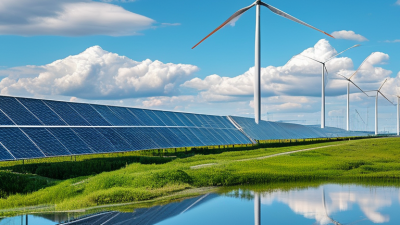
Solar panels convert sunlight directly into electricity. On a clear afternoon, rooftop panels can serve nearby appliances; after sunset, they need storage or other power sources. Wind turbines use moving air to turn a rotor and generator. Their output can rise sharply on blustery days and fall during calm spells. But timing matters. Better forecasting, transmission, and storage help match production with demand, though they add cost and planning work.

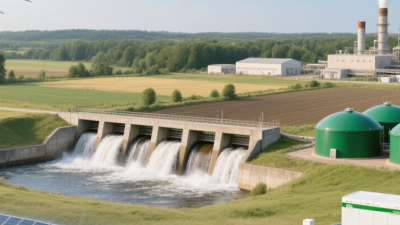
Hydropower sends flowing or released water through turbines, often providing flexible generation when demand changes. Yet drought, seasonal river flows, and ecosystem impacts can limit its reliability at particular sites.

Geothermal plants draw heat from underground reservoirs to produce steam or heat a working fluid that spins a turbine. They can generate steadily, but suitable resources are unevenly distributed and drilling is expensive. Not every site fits. These trade-offs matter as much as headline capacity figures.

(Sources: Ember, Global Electricity Review 2025; IRENA, Renewable Capacity Statistics 2025.)

How Energy Storage and Smart Grids Support Reliable Green Power

In 2026, reliable green power depends on more than building wind and solar farms. Their output shifts with weather and time of day. Storage can absorb excess electricity at noon, then release it after sunset. The IEA reported that battery storage additions reached about 42 GW in 2023, up 130% from the previous year. Its 2024 analysis says capacity would need to grow sixfold, to 1,200 GW by 2030, in a pathway aligned with global climate goals. That is a pathway, not a guaranteed forecast.

Smart grids help move this electricity where it is needed. Sensors can detect congestion, while automated controls adjust power flows and coordinate flexible demand. The IEA’s 2023 grid report estimates that 80 million kilometres of grids must be added or refurbished by 2040 to meet climate and energy goals. That is roughly the length of today’s entire global grid. A useful figure. A demanding job.

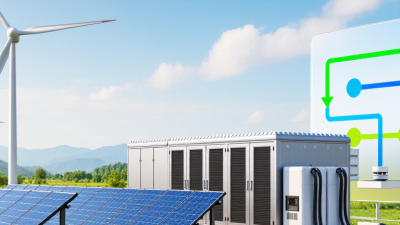
Storage and digital controls work best together: a battery near a solar-rich district can ease evening peaks, while grid operators reroute power around overloaded lines. But batteries do not solve every reliability problem. Long periods of low wind and sunlight require broader planning, including firm generation and stronger interconnections. Smart systems also depend on accurate forecasts and careful maintenance; a sensor cannot fix a neglected cable. Details matter at street level.

What Are the Best Green Power Energy Solutions in 2026? — How Energy Storage and Smart Grids Support Reliable Green Power

Solution Typical operating characteristic How it supports reliable green power Best suited for Key planning consideration
Utility-scale solar photovoltaic (PV) Output follows daylight and weather. Annual capacity factors commonly fall around 15–30%, depending on location, design, and tracking. Provides low-carbon electricity during sunny periods; pairing it with storage can shift some daytime generation into evening demand. Regions with strong solar resources, available land, and daytime electricity demand. Output varies by season and time of day; grid connections, land use, and appropriately sized storage may be needed.
Onshore and offshore wind Wind output varies with weather and site conditions. Indicative annual capacity factors are about 25–45% onshore and 35–55% offshore. Can complement solar where wind patterns differ by season or time of day, diversifying renewable generation. Windy areas with suitable sites, transmission access, and community and environmental planning. Resource variability, permitting, transmission availability, and—in offshore projects—marine construction and maintenance.
Lithium-ion battery storage Commonly configured for roughly 2–8 hours of discharge; typical system-level round-trip efficiency is approximately 85–95%. Responds quickly to grid needs, stores surplus renewable electricity, and can help manage evening peaks and short-duration fluctuations. Daily shifting of solar energy, frequency response, peak reduction, and distribution-grid support. Economics depend on cycling, power and energy sizing, degradation, safety design, and battery-material supply chains.
Pumped-storage hydropower Stores energy by pumping water uphill and generating electricity later; projects commonly provide hours of storage and can be designed for longer discharge periods. Round-trip efficiency is often about 70–85%. Offers dispatchable power and substantial storage capacity that can balance variable wind and solar generation. Systems with suitable elevation, water resources, geology, and long-term infrastructure needs. Site availability, construction time, capital costs, water impacts, and permitting can constrain development.
Flow batteries Often considered for multi-hour storage, commonly around 4–12 hours; duration can be adjusted through tank sizing. Can store excess renewable generation for later use, with designs suited to frequent cycling and longer-duration applications. Stationary grid storage where longer discharge duration and operational flexibility are valuable. System efficiency, footprint, electrolyte choice, project maturity, and total installed cost vary by design.
Thermal energy storage Stores heat or cooling—often in hot water, chilled water, or other thermal media—for use later; storage duration ranges from hours to longer periods depending on design. Moves heating and cooling demand away from peak electricity periods and can reduce strain on the power grid. Buildings, district energy systems, and industrial processes with flexible heating or cooling demand. Value depends on matching storage temperature and timing to the end use; it does not always return stored energy as electricity.
Smart grids, advanced controls, and demand response Uses monitoring, automation, forecasting, and flexible customer loads; performance is measured through grid-specific indicators rather than a single storage-duration figure. Improves visibility of grid conditions, coordinates distributed energy resources, and can shift or reduce demand during tight supply periods. Power systems with growing renewable generation, electric vehicles, smart meters, and flexible loads. Requires interoperable systems, reliable communications, cybersecurity safeguards, and customer participation.
Transmission expansion and interconnection Enables electricity to move between regions and connects renewable projects to demand centers; benefits depend on network capacity and operating rules. Shares renewable output across a wider area, helps manage local supply variability, and can reduce bottlenecks and curtailment. Regions with strong renewable resources located far from major population or industrial centers. New lines can face lengthy planning, permitting, cost allocation, and community-engagement processes.
Hybrid renewable-plus-storage systems Combine generation, such as solar or wind, with one or more storage technologies and coordinated controls. Can make output more predictable, shift electricity to higher-demand periods, and provide grid services from a coordinated site. Projects seeking to improve renewable delivery profiles or make better use of a shared grid connection. Needs careful sizing, control-system design, interconnection studies, and revenue planning across multiple services.

Note: Figures are indicative planning ranges, not guarantees. Actual performance varies with location, equipment, project design, operating conditions, and the method used to calculate system efficiency or capacity factor.

How Green Power Solutions Fit Homes, Businesses, and Communities

In 2026, the best green power solution depends on how a place uses energy. For a home, rooftop solar can supply daytime electricity, while a battery may keep essential circuits running after sunset or during an outage. A heat pump can reduce reliance on fuel-burning heating, especially in a well-insulated house. But equipment is only part of the picture. A shaded roof, an aging electrical panel, or high upfront costs can change what makes sense. Not every home needs a battery.

Businesses often have predictable energy demands that suit solar, storage, or managed charging for vehicle fleets. A grocery store, for example, may value backup power for refrigeration, while an office may benefit more from shifting flexible tasks to sunny hours. Energy audits and interval-meter data help identify those opportunities before equipment is purchased. Forecasts can still miss. Weather, operating hours, and staff habits may not match the plan, so performance should be reviewed over time.

Communities can combine shared solar projects with local storage and efficient public buildings. Residents without suitable roofs may then have access to shared generation, depending on the project’s enrollment and billing arrangements. A community microgrid can also support critical services during some grid disruptions, though its design and costs require careful study. These projects work best when residents help shape priorities early. That takes patience. Participation can be uneven, and a technically sound plan may still overlook who benefits most.

How to Compare Costs, Environmental Impacts, and Practical Constraints

Comparing green power options starts with the building and its energy use, not just the advertised price. Rooftop solar may suit a sunny home with an unobstructed roof, but repairs, shade, and roof age can change the economics. A heat pump can reduce direct fuel use, yet an older, poorly insulated house may need upgrades to perform well. The catch is real.

Look beyond installation costs. Compare expected output, maintenance, financing, equipment life, and any battery or grid connection costs. Ask for assumptions behind estimated savings, including local electricity rates and seasonal production. A system that looks inexpensive on paper may cost more if it needs major electrical work. Weather is messy.

Environmental impacts also differ by location. Solar panels and wind turbines generate power without burning fuel during operation, but manufacturing, transport, land use, and disposal matter too. Where possible, check credible lifecycle assessments rather than relying on a single emissions figure. Practical limits deserve equal attention: local grid capacity, permitting timelines, roof orientation, available space, and backup needs can narrow the choices. I would compare at least two proposals using the same assumptions, then check those assumptions against utility bills and an independent energy assessment. Those estimates are useful, not guarantees; actual output and savings can disappoint. A little skepticism helps.

What Are the Best Green Power Energy Solutions in 2026?

Lifecycle greenhouse gas emissions provide one useful way to compare power options. Lower values mean fewer emissions per unit of electricity generated.

How to read this: These are lifecycle median estimates, not a complete ranking of cost or suitability. Actual emissions vary by technology, project, and location. Costs, grid access, storage needs, permitting, and local environmental impacts also affect which solution is practical.

Source: IPCC Fifth Assessment Report, Working Group III, Annex III, Table A.III.2 (2014). Values shown in g CO₂e/kWh.

CORPORATE HEADQUARTERS

North America

California

AGIC Energy North America LLC
13025 Danielson Street, Suite 105
Poway, CA 92064 – USA
Phone Number: +1 (858) 842 1513
Email: info@site_cc52bd27-560c-4f9d-bd66-63718fc42539
Sales: sales@site_cc52bd27-560c-4f9d-bd66-63718fc42539