
How to Choose Sustainable Energy Solutions in 2026
Choosing sustainable energy solutions in 2026 is less about finding one perfect technology and more about matching real needs to reliable options. A rooftop solar system may suit a sunny home with an unshaded roof, while a heat pump could make a larger difference in a poorly insulated house. Small details matter: winter temperatures, roof age, electricity tariffs, and the hours a household uses power. Start with the building and its energy bills, not a product advertisement. That sounds obvious. It is often overlooked.
A sound decision compares expected costs, service life, maintenance, and emissions across the full system. Ask installers for itemized quotes, estimated annual output, equipment warranties, and assumptions behind their savings forecasts. Check whether local incentives and utility rules apply, since they can change and vary by location. Battery storage is not automatically worthwhile; its value depends on prices, outages, and when energy is used. Look for recognized certifications and qualified professionals, then verify claims with public energy agencies or independent technical guidance. Estimates still involve uncertainty. Weather shifts, equipment performance differs, and household habits change. A careful comparison cannot remove every risk, but it can reveal weak assumptions before money is committed. This guide explains how to assess sustainable energy solutions in 2026, weigh practical trade-offs, and choose an option that fits your property, budget, and priorities. Sometimes, the best first step is simply using less energy.
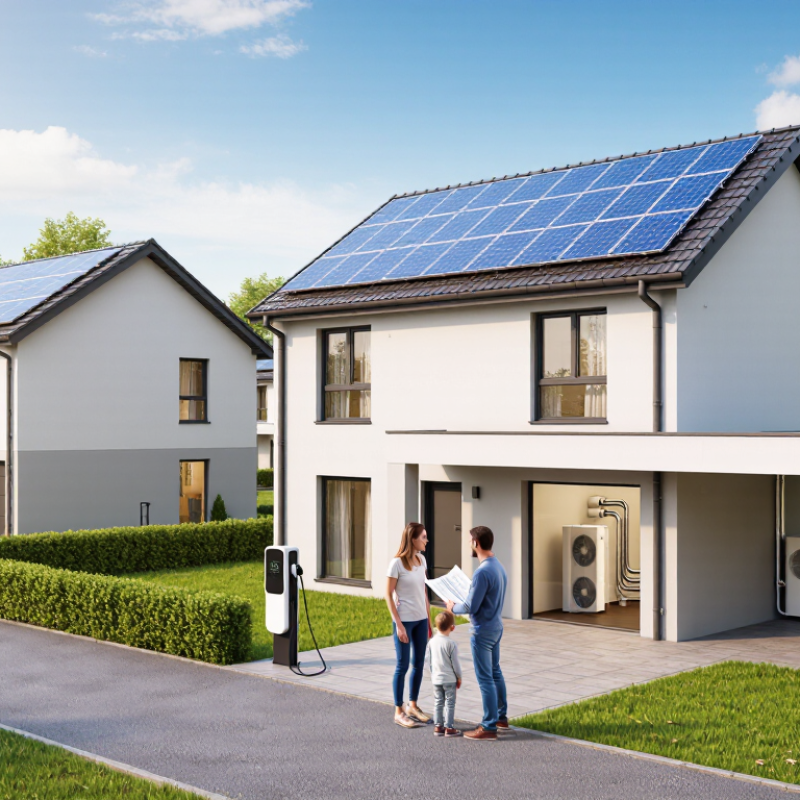
Define Your Energy Load, Site Limits, and Reliability Needs
Before comparing sustainable energy options, measure what your home or workspace actually uses. Review twelve months of utility bills, then note heavy loads such as electric heating, refrigeration, pumps, or workshop tools. Check the meter during a quiet period and again when several devices run. Small details matter. A kettle and heater running together can create a brief peak that a monthly average hides.
Next, inspect the site. Record usable roof area, shade at different times, and the distance to electrical equipment. For ground-mounted systems, note drainage, access, and space for maintenance. A sunny roof may still be unsuitable if it needs repairs soon. I once underestimated a neighbor’s afternoon shadow; the estimate looked neat, but the site did not. Measure before choosing equipment, and treat rough estimates as rough.
Reliability needs depend on what can safely wait. List essential loads, such as a refrigerator, medical equipment, or communications, and estimate how long each must run during an outage. A backup system sized for every appliance can cost more than necessary. Batteries also need enough capacity for cloudy days, not just ideal ones. Be honest about compromises. If outages are rare, limited backup may make sense; if they are frequent, resilience may matter more than the shortest payback.
How to Choose Sustainable Energy Solutions in 2026 — Define Your Energy Load, Site Limits, and Reliability Needs
Use this screening table to compare options before requesting site-specific quotes. Energy and equipment ranges are planning examples; actual performance depends on climate, building characteristics, tariffs, equipment, and local regulations.
| Planning Dimension | What to Measure | Typical Screening Data | What It Means for Solution Choice | Practical Next Step |
|---|---|---|---|---|
| Daily energy use | Electricity consumed over a full day, in kilowatt-hours (kWh), ideally from interval meter data. | A home might use roughly 10–40 kWh/day; a small commercial site may use 50–500+ kWh/day. Actual usage varies widely. | Daily consumption helps estimate renewable generation and storage needs. Lowering avoidable demand can reduce the size and cost of the system. | Review 12 months of utility bills and, where available, hourly or 15-minute usage data. |
| Peak demand | The highest simultaneous electrical load, measured in kilowatts (kW). | Peak demand can be much higher than average demand when heating, cooling, cooking, pumps, or machinery operate together. | Inverters, backup generators, and electrical panels must handle the relevant peak load—not just average daily use. | List large appliances and equipment, including their power ratings and whether they can run at the same time. |
| Load timing | When electricity is used, including daytime, evening, seasonal, and time-of-use patterns. | Solar PV produces during daylight; household demand often rises in the morning and evening. Commercial loads may be concentrated in business hours. | Loads that coincide with solar output can use solar electricity directly. Batteries or load shifting may help when use occurs after sunset or during high-price periods. | Compare an interval-use chart with local solar production estimates and the applicable electricity tariff. |
| Critical-load requirement | Which circuits must remain powered during an outage, and for how long. | Critical loads may include refrigeration, communications, essential lighting, medical equipment, controls, or selected pumps. | A backup system designed for selected circuits is usually smaller than one intended to power an entire property, especially during peak demand. | Separate essential loads from deferrable loads and estimate their combined kW and kWh for the desired backup period. |
| Site solar access | Usable roof or ground area, orientation, tilt, shading, structural condition, and access for installation. | As a rough planning allowance, 1 kW of modern rooftop PV may require about 5–8 m² of module area; layouts and clearances need additional space. | Limited or shaded space may reduce solar output or make efficiency, load reduction, or off-site renewable electricity more relevant. | Check shading throughout the day and year, roof condition, structural capacity, and local setbacks before estimating system size. |
| Local solar resource | Expected solar production for the specific location, orientation, tilt, and system design. | Annual PV yield varies substantially by location and conditions; a preliminary estimate should use local weather and system-loss data rather than a universal output figure. | Two similarly sized PV systems can produce different amounts of electricity in different climates or on differently oriented sites. | Use a location-specific production estimate and compare annual output with monthly consumption, not just the annual total. |
| Space and equipment limits | Available area for panels, batteries, heat-pump equipment, wiring, ventilation, and required clearances. | Battery capacity is measured in kWh; inverter output is measured in kW. These are separate constraints and both matter for backup performance. | Small indoor or outdoor equipment areas can limit storage or system layout. Battery location must also meet applicable fire, access, and building requirements. | Confirm equipment dimensions, access routes, environmental conditions, and local permitting requirements with a qualified installer. |
| Heating and cooling loads | Space-heating, water-heating, and cooling energy use, plus the existing equipment and fuel type. | Heat-pump performance depends on climate, equipment design, building insulation, and operating conditions; cold-weather capacity should be checked for the local design temperature. | Efficiency upgrades and building improvements can reduce energy demand before renewable systems are sized. Electrification may increase electricity use while reducing on-site fossil-fuel use. | Review insulation, air sealing, equipment condition, and seasonal bills; ask for performance data at local operating temperatures. |
| Outage frequency and duration | How often outages occur, their typical duration, and the consequences of losing power. | Grid-connected solar systems commonly shut down during an outage unless designed with approved islanding and backup equipment. | Solar alone may reduce grid purchases but may not provide outage power. Batteries, backup generation, or a hybrid system may be needed for resilience. | Check utility outage history and identify the minimum backup duration and loads required for safe operation. |
| Battery sizing | Usable stored energy (kWh), continuous and surge power (kW), and round-trip efficiency. | A first-pass energy estimate is critical-load kW × backup hours, adjusted for conversion losses and usable battery capacity. | A battery with enough kWh may still be unable to start or run a high-power device if its kW output is insufficient. | Size storage against critical loads and outage duration; confirm continuous output, surge capability, usable capacity, and operating limits. |
| Grid connection and export rules | Service capacity, interconnection requirements, export limits, metering, and compensation for exported electricity. | Rules and electricity-credit rates vary by utility and jurisdiction; some sites may face limits on exporting power to the grid. | Export limits and tariff structures can change the value of PV, batteries, and flexible loads. A system should be evaluated using the actual local rules. | Request the current interconnection requirements and tariff details before finalizing system design or financial estimates. |
| Reliability strategy | Required level of service, acceptable downtime, fuel availability, and ability to manage loads. | Grid-connected PV, PV with batteries, and hybrid systems provide different combinations of bill savings and backup capability. | Choose based on the consequence of an outage, not only annual energy savings. Critical facilities may need redundancy and a documented operating plan. | Compare normal operation, a short outage, and a prolonged outage; identify how loads will be prioritized in each case. |
| Efficiency and demand flexibility | Opportunities to reduce consumption or shift flexible tasks to times of greater renewable supply. | Examples include efficient lighting, improved controls, insulation, and scheduling water heating or charging during suitable low-cost periods. | Reducing or shifting demand can lower peak power needs and improve the use of on-site renewable generation. | Identify low-cost efficiency measures and flexible loads before deciding on generation and storage capacity. |
Related Posts
-
China Top 10 Energy Storage Solutions Manufacturers
-
2026 Best Green Energy Solutions for Global Buyers
-
How to Choose Green Power Solutions for Your Business?
-
10 Tips for Choosing Renewable Energy Storage Solutions
-
What Are Renewable Energy Storage Solutions?
-
10 Best Solar Power Solutions for Sustainable Energy Use?
CORPORATE HEADQUARTERS
North America
California
AGIC Energy North America LLC
13025 Danielson Street, Suite 105
Poway, CA 92064 – USA
Phone Number: +1 (858) 842 1513
Email: info@site_cc52bd27-560c-4f9d-bd66-63718fc42539
Sales: sales@site_cc52bd27-560c-4f9d-bd66-63718fc42539